Code Coverage based on Unit Tests
This template relies on the use of the coverage module in conjunction with the unittest/pytest modules to automatically compile code coverage reports.
Underlined here is the importance of writing tests which not only maximize coverage, but also prevent breaking applications later during refactoring and maintenance stages of a project’s lifecycle.
Warning
Code coverage alone is not a good indicator of project health. But it’s a start.
Coverage Makefile Targets
The makefile offer the test and the coverage targets. The former collects and run unit tests while gathering coverage statistics. The second target calls test then generates an html report, located under reports/coverage/ (as well as printing out stats in the console).
Note
For more info on code coverage in python, see https://coverage.readthedocs.io/en/latest/#quick-start
For computing the current coverage of your working directory, simply run:
make coverage # depends on clean and test targets
Which will runt all the tests, and will output the coverage file by file:
Name                                     Stmts   Miss Branch BrPart  Cover   Missing
------------------------------------------------------------------------------------
app/main.py                                 16      1     10      1    92%   62, 61->62
test/test_app/test_main.py                  12      0      0      0   100%
test/test_methodology/test_examples.py      12      1      0      0    92%   49
test/test_tools/test_path_explorer.py       30      0      4      0   100%
test/test_tools/test_pretty_console.py      38      1      2      0    98%   86
tools/path_explorer.py                      27      0     18      0   100%
tools/pretty_console.py                     35      2      8      1    93%   15, 100, 99->100
------------------------------------------------------------------------------------
TOTAL                                      170      5     42      2    97%
Additionally, the coverage routine also generates an HTML report (see reports/coverage/index.html) which has the added benefit of highlighting the code statements executed and skipped.
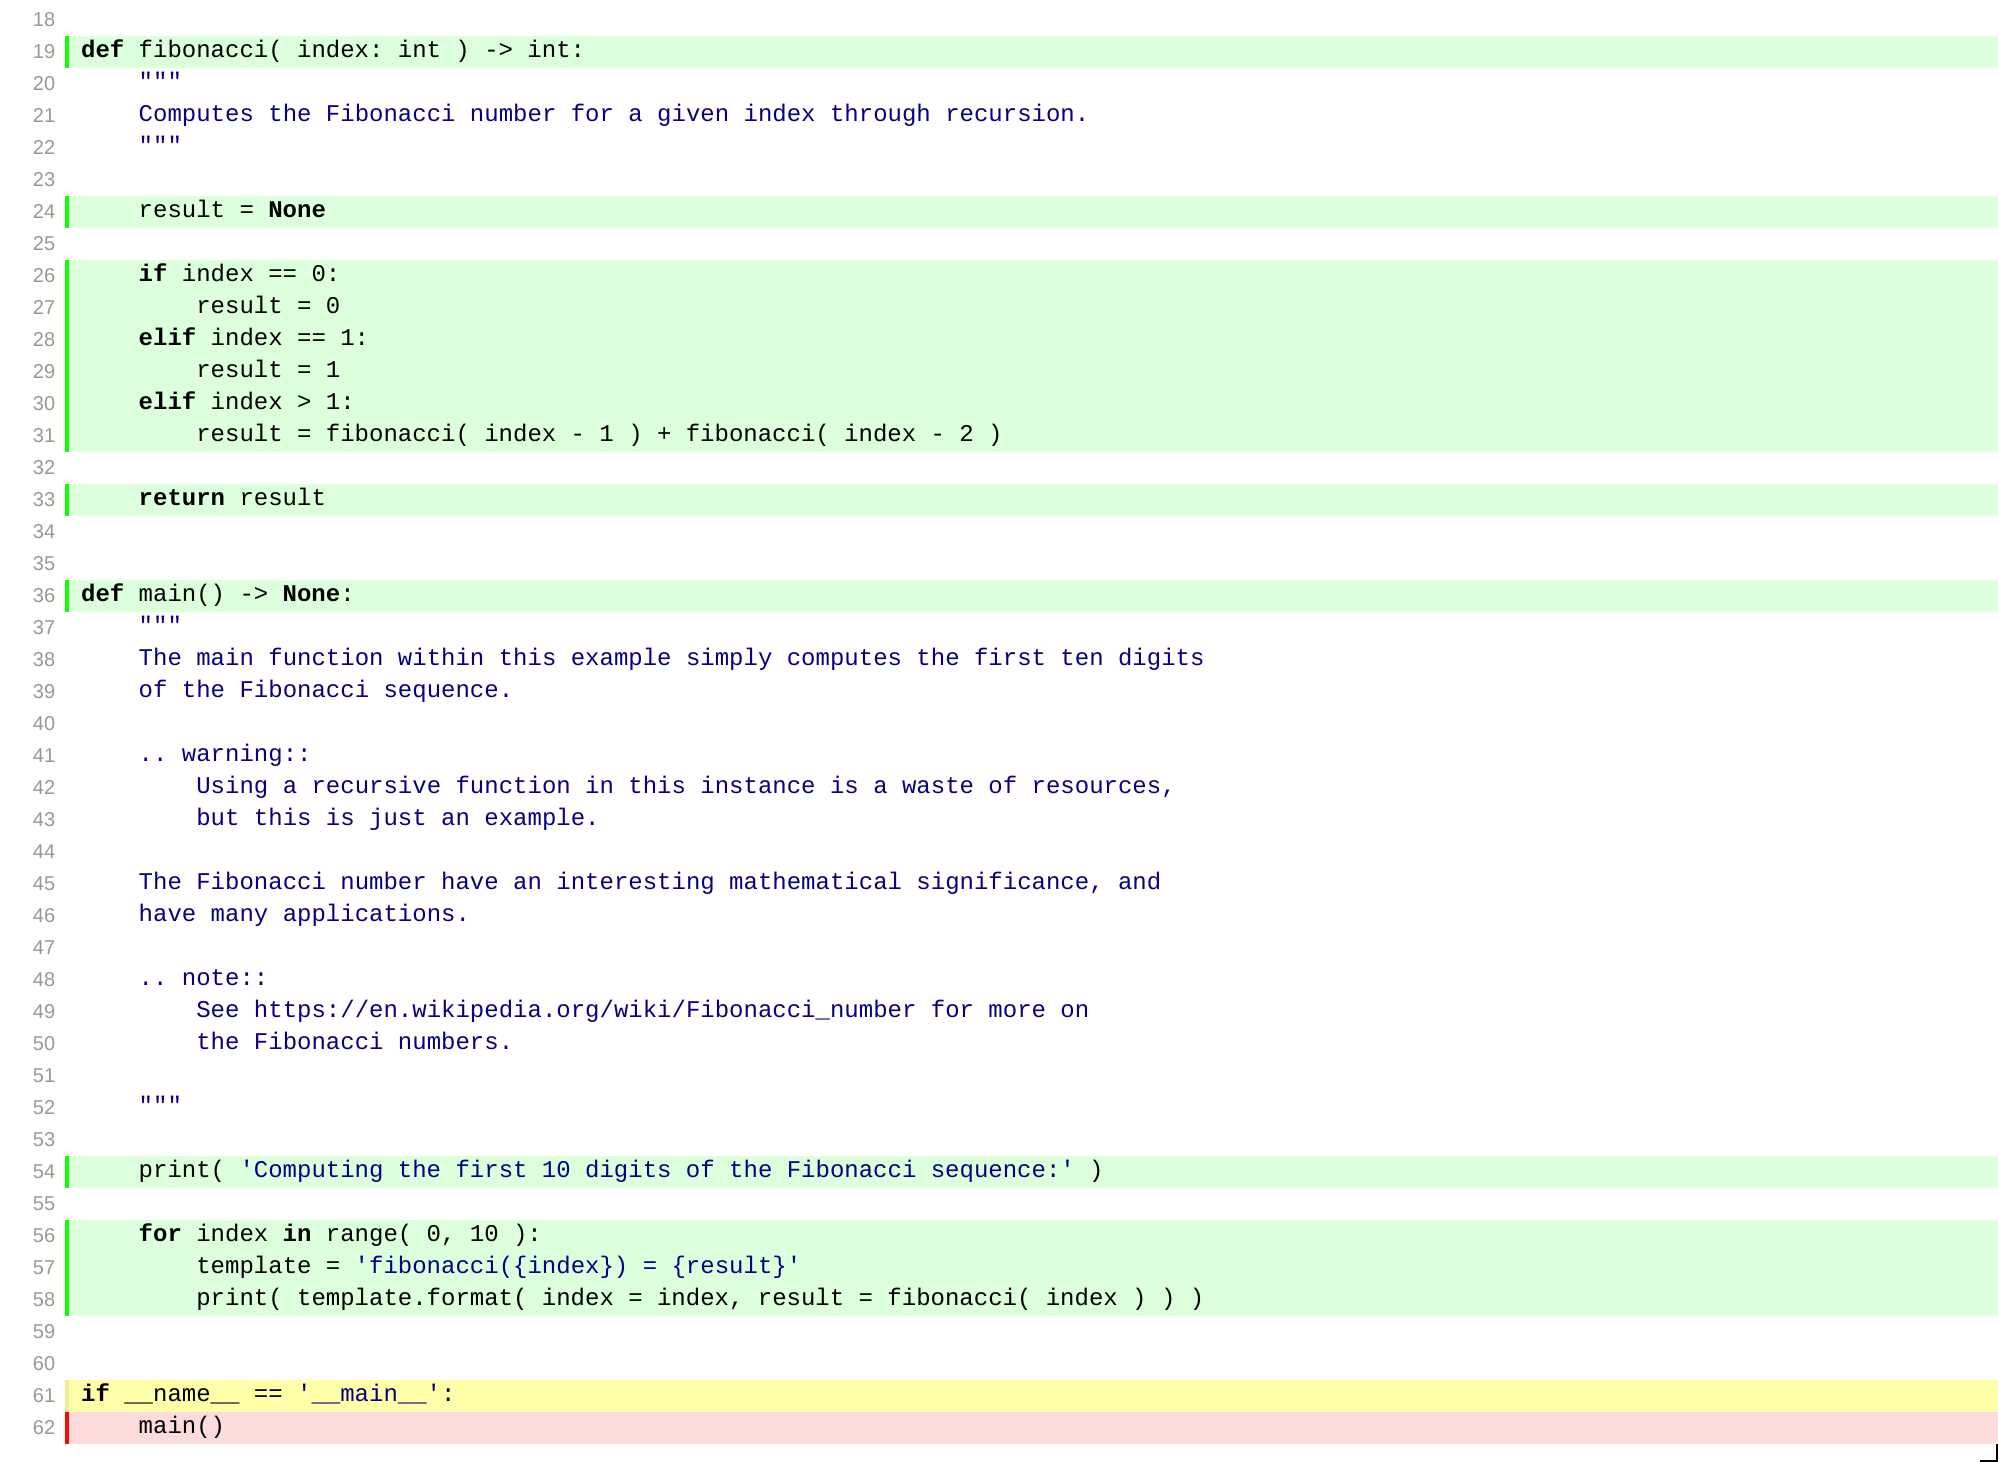
Coverage report highlighting
Note
Code coverage can be easily integrated with travis and codecov using the codecov module.
Uploading to Codecov.io
Computing code coverage locally is a nice tool, but most importantly, the ability to follow the evolution of your coverage throughout the development cycles of your application is a very effective metric to know how your process is evolving, and whether or not your investment on testing in increasing or decreasing.
This is achieved through a configuration file .codecov.yml located at the root of the project directory:
coverage:
  status:
    patch: no
    changes: no
    project:
      default: false
      app:
        paths: "app/"
        target: 75%
      tests:
        paths: "test/"
        target: 95%
      tools:
        paths: "tools/"
        target: 85%
And a few special directives to the .travis.yml:
language: python

python:
  - "3.7"

addons:
  apt:
    packages:
      - libenchant-dev
      - graphviz

install:
  - "pip install -r requirements.txt"
  - "pip install codecov"

script:
  - "make check PYTHON=\"python\""
  - "make coverage PYTHON=\"python\""
  - "make doc PYTHON=\"python\""

after_success:
  - "codecov"
Therefore, the continuous integration build is also setup to upload code coverage statistics to Codecov.io automatically if the build was successful. It has the added benefit of offering much better visualization of your coverage.
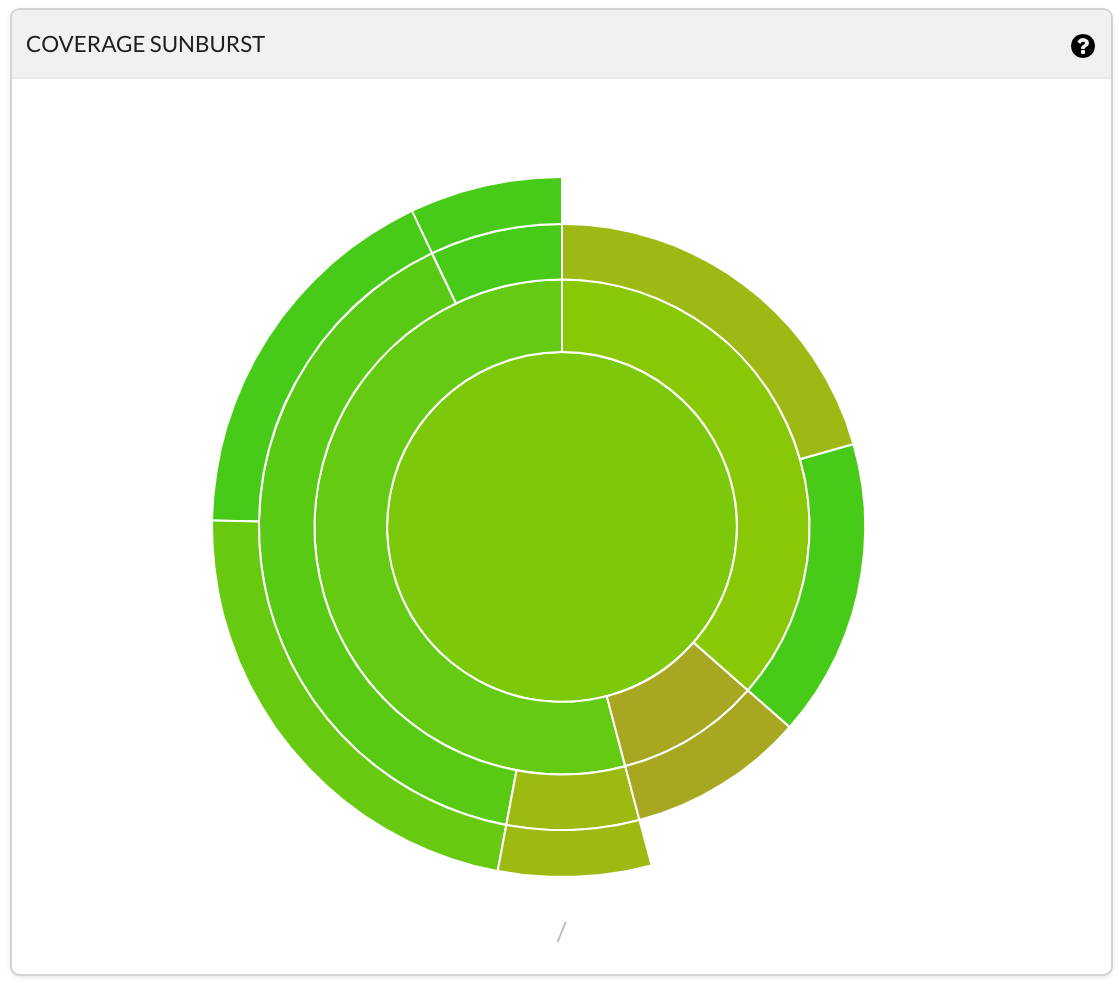
Coverage ‘Pie’ for the complete project.
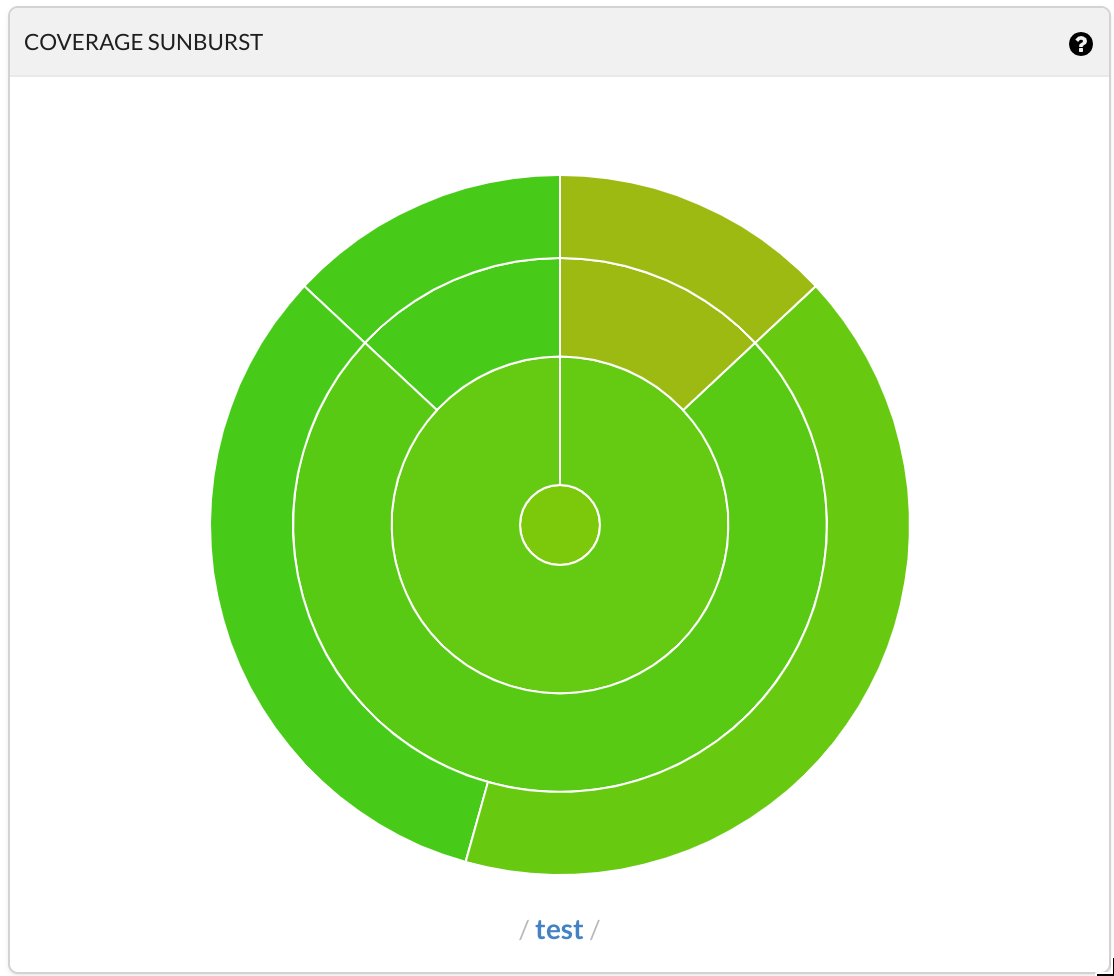
Coverage ‘Pie’ for the test/ folder.
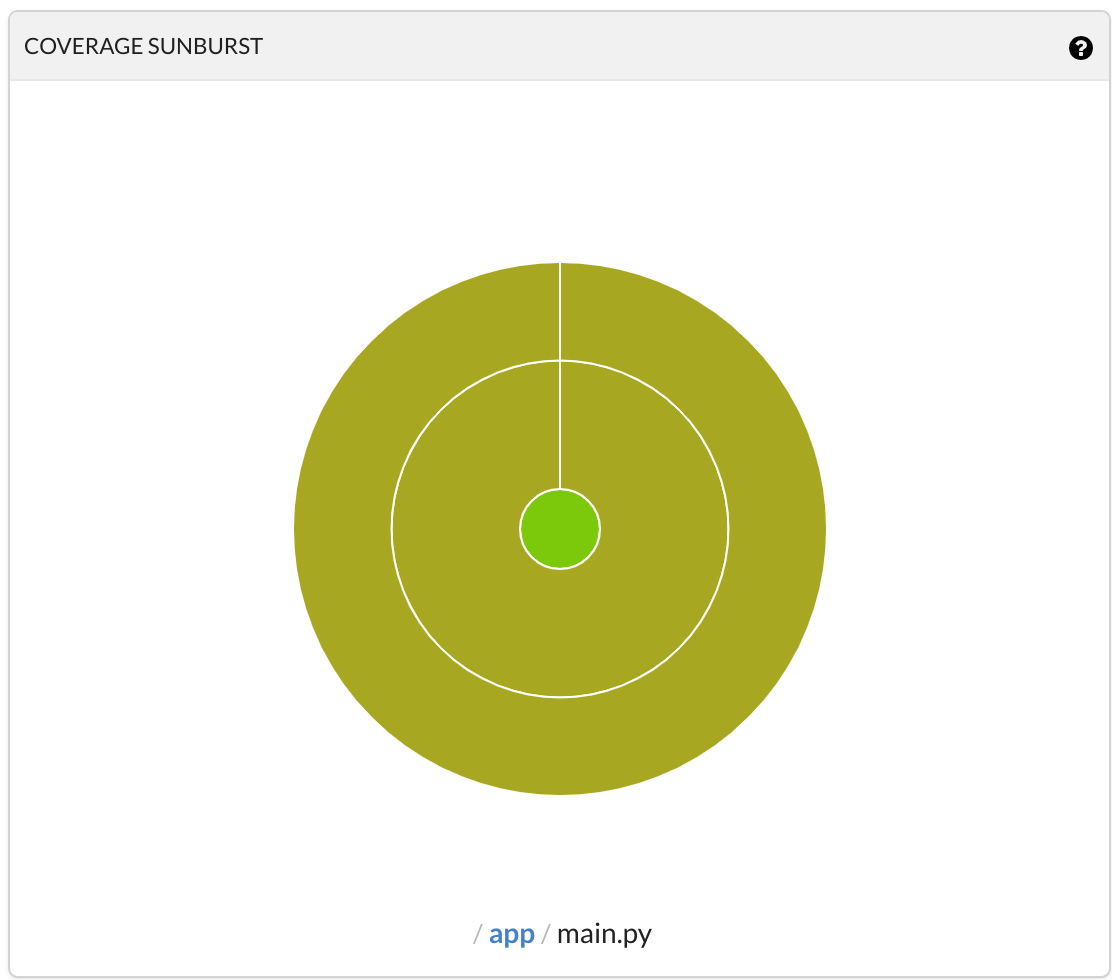
Coverage ‘Pie’ for the app folder.
Note
More on Codecov’s graphs at https://docs.codecov.io/docs/graphs#section-sunburst
Codecoverage as a Check in GitHub
One of the main advantages to this approach is that you can extrapolate ‘quality gates’ directly from the coverage targets, which will define whether of not your CI status is a pass or a fail, for example while preparing a new pull request (if you have linked Travis and Codecov to your github project).
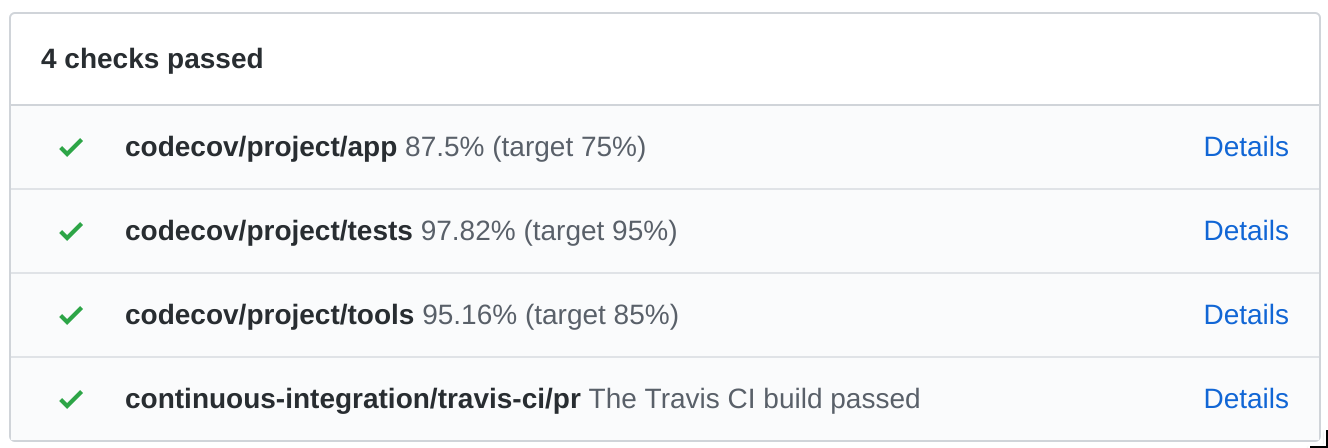
Recorded checks status after a merged PR.
Discussion on Coverage Targets
There is no right or wrong approach to code coverage. Generally speaking, the obvious rule is more is better but you should be weary of not confusing code coverage for functional testing. It is but a metric informing you about how much of the code was executed once, but does not necessarily prove the stability, robustness or overall quality of an application or module.
So let’s discuss coverage targets with that in mind. What is a coverage target? Well, it’s a local or global coverage limit you deem acceptable for a project or portions of it. It implies that a lower score than the expected target should constitute a fail in regards to continuous integration.
Let’s dive in this projects’s default targets by looking at the Codecov configuration file we looked at earlier:
project:
    # [...]
    app:
        paths: "app/"
        target: 75%
    tests:
        paths: "test/"
        target: 95%
    tools:
        paths: "tools/"
        target: 85%
In essence, this configuration defines different targets for different sub-folders. Behind these numbers lie a few important concepts:
The app
It’s likely a waste of time to try and cover 100% of your app - think return on investment - but considering good development practices, and a drive for quality anything below 60% might be considered dangerous on the long game.Now, of course, it will depend on so much more than than: the application life cycle, the expected reuse of modules, shared dependencies, time constrains, etc…
All critical components of your app should be tested, but some tests might be too complicated to automate. I find between 50% and 80% to be a sweet spot for trusting your continuous integration will catch a few bullets for you.
The tests
The testing code itself should always be close to 100% coverage except if you’re expecting to skip some tests (this is the case in this project). Hence it’s good practice to separate that coverage from your other coverage metrics, otherwise it will artificially bump your coverage scores up even if you have 1% of your app actually tested.
The 100% coverage has a lot to do with approaches such as Test Driven Development - which is a good thing - but in my opinion, passing tests is not the only tool in your arsenal. I cover a few concepts about testing in the Unit Tests section, which bring me to the following conclusion:
It might not be in your best interest to expect 100% test coverage due to skipped tests and expected fails. This is true here, and the reason why the test/ coverage target is only set to 95%.
The tools
There is no reason you should skip testing your environment as well as your application. After all, breaking your tools is likely to have serious side effects on your CI and other quality gates.
Yet again, it all boils down to the return on investment. And your environment being a building block for all the effort spent on the application itself, it’s likely that that time is a good investment.